A trading strategy is a set of rules that tells you when to enter a trade, when to exit, and how much to risk. Clear rules make your decisions consistent and let you measure what works. The strategies below are popular starting points for beginners. They are educational examples, not recommendations, and no strategy wins every time.
Important: all examples use hypothetical prices. Test any strategy on a demo account first. Past patterns do not guarantee future results.
Moving average strategy
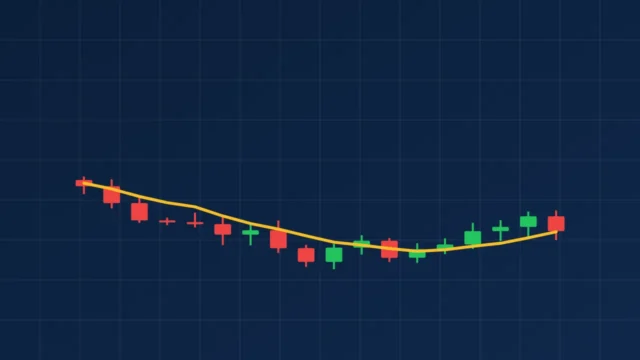
A moving average (MA) smooths price data by calculating the average price over a set number of periods. It helps you see the direction of the trend without the noise of every candle.
- A Simple Moving Average (SMA) gives every period equal weight.
- An Exponential Moving Average (EMA) gives more weight to recent prices, so it reacts faster.
How traders use it
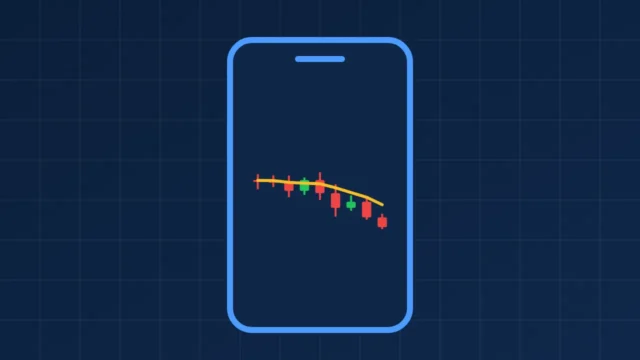
- Trend direction: price above a rising MA suggests an uptrend; price below a falling MA suggests a downtrend.
- Dynamic support and resistance: in a trend, price often pulls back towards the MA before continuing.
- Crossovers: when a faster MA crosses above a slower MA, some traders treat it as a buy signal, and the opposite as a sell signal.
Limitation: moving averages lag behind price. In sideways markets they produce many false signals.
50 EMA and 200 EMA strategy
This is one of the best-known trend-following setups. The 200 EMA shows the long-term trend, and the 50 EMA shows the medium-term trend.
Basic rules (example)
- Add a 50 EMA and a 200 EMA to an H4 or daily chart (in MetaTrader: Insert > Indicators > Trend > Moving Average, method Exponential).
- Only look for buy trades when the 50 EMA is above the 200 EMA and price is above both. Only look for sell trades when the 50 EMA is below the 200 EMA and price is below both.
- Wait for price to pull back towards the 50 EMA.
- Enter when a candle closes back in the trend direction, for example a bullish candle after a pullback in an uptrend.
- Place the stop-loss beyond the recent swing low (for buys) or swing high (for sells).
- Set a take-profit at least twice the distance of your stop-loss, or trail the stop as the trend continues.
Hypothetical example
On the daily EUR/USD chart, the 50 EMA is above the 200 EMA. Price pulls back from 1.1200 to the 50 EMA near 1.1100, then a bullish candle closes at 1.1120. A trader buys at 1.1120, places a stop-loss below the swing low at 1.1070 (50 pips) and a take-profit at 1.1220 (100 pips), a 1:2 risk-to-reward ratio.
When the 50 EMA crosses above the 200 EMA, the event is often called a golden cross; a cross below is called a death cross. These are slow signals and work best in strongly trending markets.
Support and resistance
Support is a price area where buying interest has previously stopped a decline. Resistance is a price area where selling has previously stopped a rise. These levels matter because many traders watch the same prices.
How to draw them
- Start on a higher timeframe such as the daily chart.
- Find areas where price has turned around at least two or three times.
- Draw horizontal lines or zones through those turning points. Treat them as areas, not exact prices.
- Round numbers, such as 1.1000 on EUR/USD, often act as psychological levels.
Trading ideas
- Bounce: buy near support or sell near resistance, with a stop-loss just beyond the level.
- Role reversal: once resistance breaks, it often becomes support, and vice versa.
Trend trading
Trend traders aim to trade in the direction of the main market movement. The idea is summed up in the saying “the trend is your friend”.
- An uptrend forms higher highs and higher lows.
- A downtrend forms lower highs and lower lows.
- A trendline connects two or more swing lows in an uptrend, or swing highs in a downtrend.
A common approach is to identify the trend on the daily chart, then look for entries on the H4 or H1 chart when price pulls back to a trendline, moving average or support level. The trend is considered at risk when the pattern of highs and lows breaks.
Breakout trading
A breakout happens when price moves decisively beyond a support or resistance level or out of a range. Breakout traders try to catch the start of a new move.
- Identify a clear range or consolidation, such as the quiet price range during the Tokyo session.
- Wait for a candle to close beyond the range rather than entering on the first touch.
- Enter in the breakout direction, or wait for a retest of the broken level.
- Place the stop-loss back inside the range.
Watch out for false breakouts: price sometimes breaks a level and quickly reverses. Waiting for a candle close or a retest reduces, but does not remove, this risk. Breakouts around major Forex news releases can be especially fast and unpredictable.
Risk management
Risk management is the part of a strategy that keeps you in the game. Even a good strategy has losing streaks, so the goal is to make sure no single trade, or run of trades, can seriously damage your account.
The 1% rule and position sizing
Many educators suggest risking no more than 1% to 2% of your account on any single trade. Here is how to calculate position size:
Position size formula
Position size (lots) = Amount at risk ÷ (Stop-loss in pips × Pip value per lot)
Account balance: $2,000. Risk 1% = $20. Stop-loss: 25 pips on EUR/USD. Pip value for a standard lot: about $10.
Position size = $20 ÷ (25 × $10) = 0.08 lots (8 micro lots).
Other risk rules
- Use low leverage, especially while learning.
- Set a daily or weekly loss limit and stop trading when you reach it.
- Avoid opening several trades that depend on the same currency, such as buying EUR/USD and GBP/USD at the same time, because they are often correlated.
- Keep a trading journal recording each trade, the reason for it and the result.
Stop-loss and take-profit basics
A stop-loss order closes a trade automatically at a set price to limit your loss. A take-profit order closes a trade at a set price to secure a gain. Both can be set when you open the trade in MetaTrader or added later by modifying the position.
Where to place a stop-loss
- Beyond a recent swing high or low.
- Beyond a support or resistance level.
- Based on volatility, for example using the Average True Range (ATR) indicator.
Avoid placing stops so close that normal price noise triggers them, or so far that one loss is too large for your account.
Risk-to-reward ratio
The risk-to-reward ratio compares your potential loss with your potential gain. With a 1:2 ratio you risk $20 to aim for $40. A favourable ratio means you do not need to win most of your trades to break even, although no ratio guarantees profit.
Note: in very fast markets or when prices gap, a stop-loss may be filled at a worse price than requested (slippage). Some brokers offer guaranteed stops for a fee.
Frequently asked questions
What is the best Forex strategy for beginners?
Simple trend-following strategies on higher timeframes, such as the 50 EMA and 200 EMA approach on the daily chart, are often easiest to learn. The best strategy is one you understand fully and can follow consistently.
How many indicators should I use?
Usually only a few. Too many indicators give conflicting signals. Many traders combine price action with one or two indicators, such as moving averages.
Can a strategy guarantee profits?
No. Every strategy has losing trades and losing periods. Risk management decides how well you survive those periods.